What we can learn from DCF's most recent placement data
I was actually really surprised.
Every year or so, I ask Florida DCF for a copy of their placement database. It comes to me as an anonymized spreadsheet, a snapshot of the system with one line for each home that every foster child has been in since 2004. It covers 342,000 children, 251,000 providers, and 1.5 million placement episodes or times the children lived in a specific home or program.
You can use the database to follow a single unnamed child through their time under DCF’s supervision. For example, the child with the most entries in the database had 488 placement episodes, with a large number of those being runaway incidents in and out of group homes. Or you can explore macro level trends to see what happened across the whole state, or in regions, counties, and zip codes.
This is a macro level post. Let’s see what’s been going on in Florida’s foster care system recently.
The Fewest Kids in 20 Years
By adding and subtracting every time a child comes in and out of the system, you can calculate a running daily census. This number surprised me: Florida’s out-of-home custody population is the smallest its been since we started keeping detailed data. We hit the previous lowest point on August 14, 2013 with 17,535 children. On the last full day of the database snapshot, July 8, 2024, the number was 17,317.
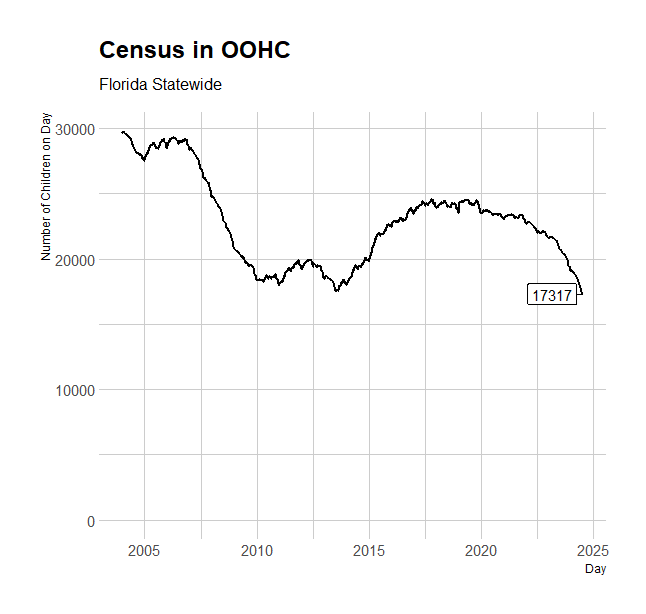
The historical context is very different between those two points. From about 2007-2011, Florida and many other states made an effort to shrink their systems by half. The effort was genuine, but we didn’t quite make it. Florida managed to get about a third of kids into permanent homes, largely through guardianships and adoptions, and slowed the removal of new kids when possible. The decrease was sharp because of the intense focus on both reducing removals and getting kids home. Half of that effort was undone during the Scott administration.
In 2018, the federal government authorized reimbursement for money states spent keeping children in their homes, so-called “preventative services.” Before that change, states had to pay out of their own pockets to keep kids safely at home, but could get federally reimbursed if they took a child into foster care. The incentive to remove kids in borderline cases was clear.
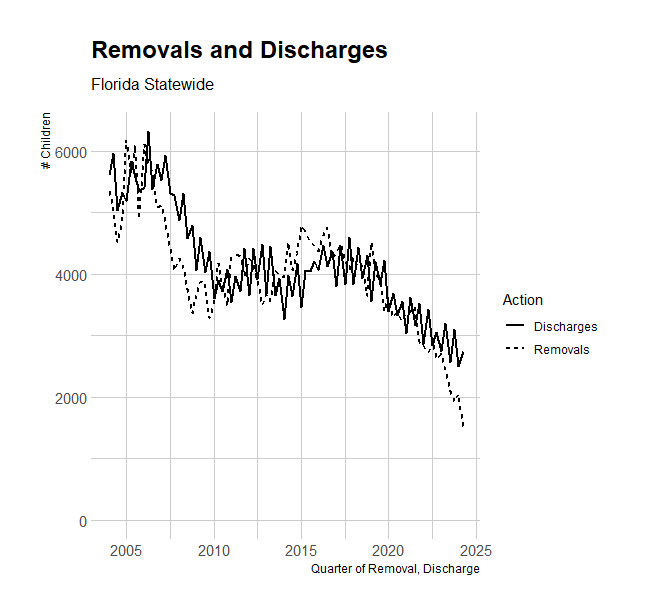
The chart below shows the number of removals and discharges each quarter. It took time for the federal change to make its way through Florida, but you can see that removals had already started levelling and then dropping from 2015-2017. There also isn’t the same uptick in discharges in 2020 that you see in 2007. If anything, discharges were lower as the number of kids in the system decreased. The gradual contraction we see from 2017-2024 is largely a result of diverted removals, especially in the last year.
But not everywhere all at once
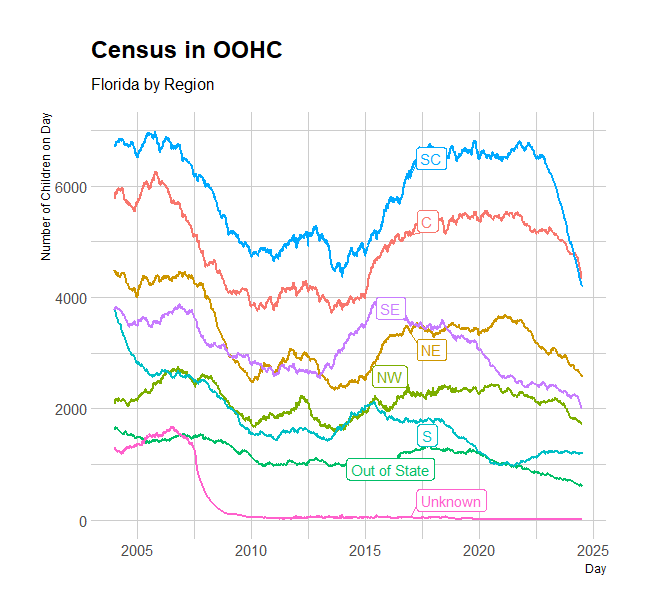
You can see below that not every region had the same decrease in out-of-home custody population. Florida’s system is privatized, meaning different private agencies contract to manage its operations around the state. They all work under the same statutes and rules, but the implementation can vary widely.
The Suncoast Region, which covers the southwest coast in Pasco down to Collier counties, saw the sharpest decrease. The decrease happened across the region, but was most pronounced in the Sixth and Thirteenth Circuits, or Tampa and St. Petersburg, which moved about 1,000 children out of their custody each. The Suncoast Region gave up its spot as the largest region for the first time ever.
Meanwhile, the Southern Region, Miami-Dade and the Keys, actually grew slightly after briefly being outnumbered by the children placed out of the state. Everywhere else has gradually gone down.
Where did they go?
Here’s the last chart for now. Starting around 2017-18, the quarterly number of kids exiting to reunifications and guardianships decreased by half, while the number of kids who were adopted or aged out remained about the same (with a slight dip after 2020). In the last quarter, more kids were adopted than reunified. That had never happened before.
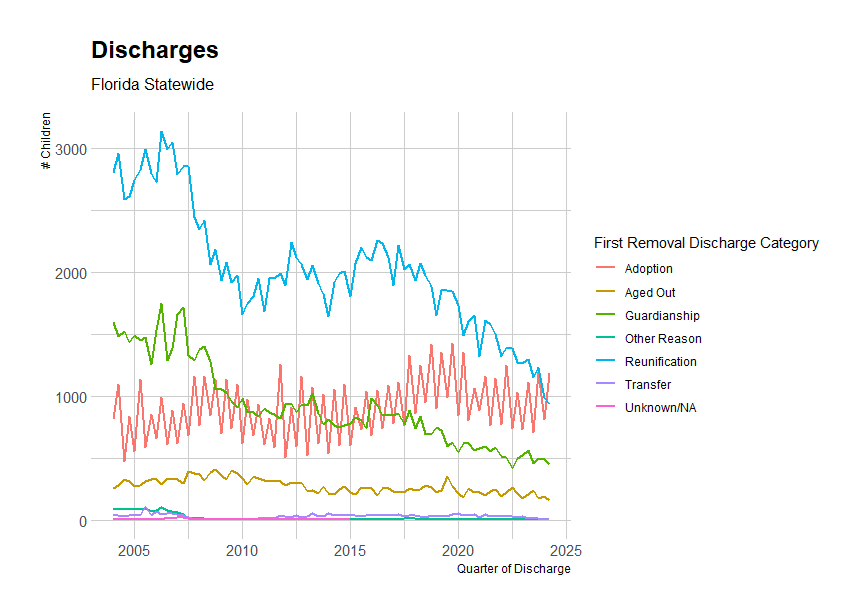
This presents the most important policy question about the fed’s changed rule on funding of preventative services. What happened to the kids who would have been removed and later reunified? Did their families benefit from material support that eliminated DCF’s perceived need for removal? Are they still under DCF supervision with no court oversight? Or were they pushed into alternative family custody arrangements that don’t offer services or the same paths to going home that the otherwise awful dependency process offers?
Next time we’ll look at how the demographics of who is in DCF custody has changed and how that’s impacted everything in the system from placements to permanency.
Definitely interesting data, follow up would be interesting in these cases to see how the child, or aged out adult faired.